
8 Free & Paid Google Analytics Reporting Tools 2026 (including GA4)
Find the best Google Analytics Reporting Tool and create and share reports in just a click with your clients/team!

Do you know that 35,383,808 live websites are currently using Google Analytics? Well, that’s not the only breaking news! Now, Google Analytics 4 (also known as GA4) is going to take over the analytics game. So before everything changes and new properties get rolled out, it is time to set yourselves up for better, automatic Google Analytics reporting.
Google Analytics reporting tools can help you refine the data that Google Analytics offers and make it easier for you to measure the performance of your website. If you are someone who thinks a lot of their time is utilized just wandering around your Google Analytics account, looking at numbers, this blog is going to be a life-saver!
I have found some handy tools that will save you time and can automatically create Google Analytics reports for you in real-time and will be compatible with GA4 too! So, without any further delay let me share with you the top 8 google analytics reporting software that can be a real-time-saver for you.
What is Google Analytics?
If you are new to Google Analytics, it is a tool that helps in web analysis. It helps in optimizing your website by analyzing its data. It integrates with Google Ads, and emails and keeps a track of real-time data to provide you with valuable insights. It can help you in optimizing your website’s performance as well. With Google Analytics, you can look at your data across platforms that are web and app and understand how users find your website, what is the ROI, and so on.
Until now, Google Analytics was using its Universal Analytics version that allowed you to track different kinds of data from your marketing campaigns. Now, GA4 is taking over Universal Analytics which will take care of both web and mobile application metrics with various new features like:
- Total users: Metric for total number of users
- New users: Metric for number of users who interacted with your site or launched your app for the first time
- Active users: Number of users that have been active within a 28 day time period
- PageView: Total number of app screens and/or web pages your users saw
And many more! Understanding Google Analytics data can be a little difficult for marketers, especially after the launch of GA4. This is why they use Google Analytics reporting software to simplify the data and use it for growing their business.
Key features of Google Analytics Reporting Tools
Before I share the list of Google Analytics report generators with you, here are a few features to look for in an ideal data reporting tool.
- Data visualization
The Google Analytics reporting tool that you use should help you visualize data in an easy-to-understand manner. This way it will be much easier for you to understand the marketing data. For instance, it should provide separate reports for advertising, audience, behavior, conversion, etc.
- Data management
It should be easier for you to import and export data to and from the Google Analytics reporting tool respectively. It should include access management features that can allow you to share data with your team and ensure who can edit it, view it, or comment on it.
- Campaign measurement
The Google Analytics tool that you use must help you analyze the progress of your marketing campaigns. It should be able to showcase the path that users generally follow on your website through metrics like time spent by users, searching for products and conversion.
- Goal tracking
Every marketing campaign has its own goals, whether it is attracting more users, increasing sales, or increasing traffic on your website. The software that you use should help in evaluating the success of your marketing campaigns and showcase whether you are meeting your goals or not.
- Audience information
Audience reports help you understand the demographics, geo-location, interests, and key browsing features. Audience reports provide you with actionable insights such as what attracts the users and which products are more liked by the audience and so on.
Why do Businesses Need Google Analytics Reporting?
Google Analytics Reporting is necessary for every online business today as it helps in understanding the performance of your marketing efforts and the performance of your website. These reports are easy to understand and give actionable insights about your business without wasting your time. In just a few clicks, you can get real-time data about your website and find what’s working for you and what’s not.
Best Google Analytics Reporting Tools
1. Stackby
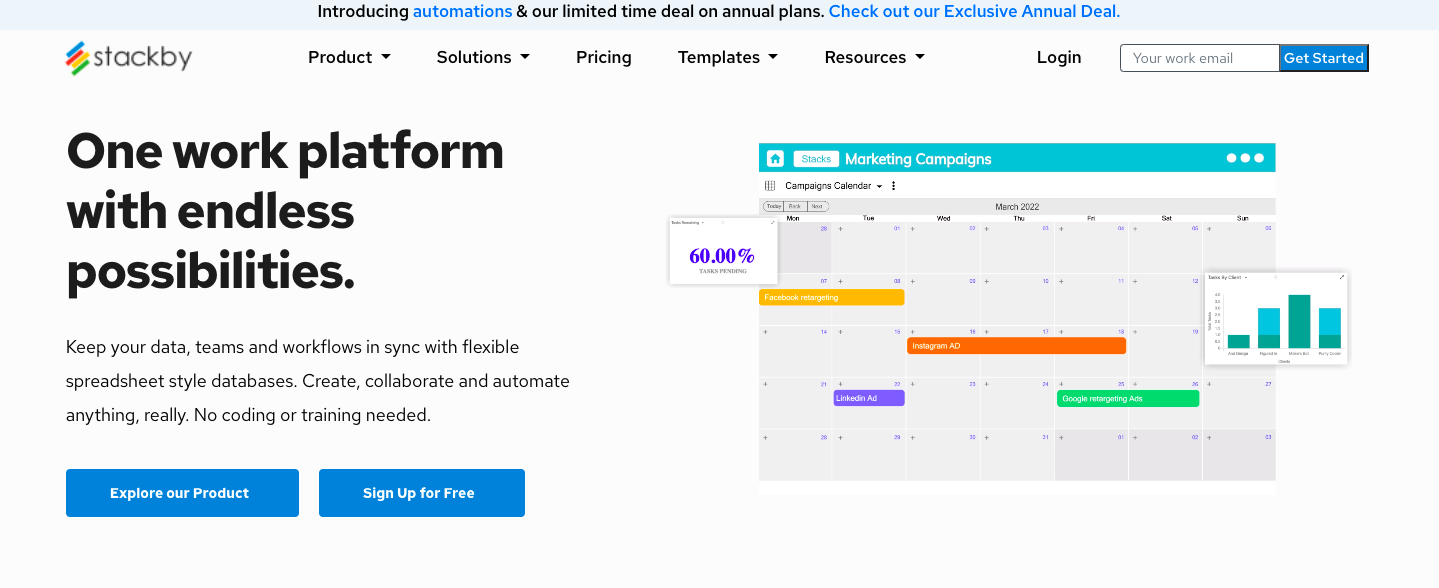
Stackby brings an easy-to-use Google Analytics Reporting tool that can help you bring data in real-time from your Google Analytics account and find deep insights about your website’s performance. Stackby supports both Universal Analytics and the new GA4 APIs. So you will face no issues at all in fetching data from Google Analytics.
With Stackby’s Google Analytics reporting tool, you can track the User data, Sessions data, and Traffic data from all your marketing channels based on the View IDs. It helps you include important KPIs in your report such as:
Reporting Controls: They provide a summary of all the main Google Analytics metrics like the percentage of new sessions, new users, sessions per user, etc.
Users and Traffic: You can get all the details of User data from Google Analytics such as the percentage of new sessions, new users, sessions per user, etc.
Sessions: You can overview all the metrics related to sessions such as hits, sessions, average session duration, bounces, bounce rate, etc.
Also add about other API functions, please check there are 10 API functions - for Ecommerce, Goal Conversions etc.
You can use different API functions to fetch different types of metrics to your Stackby Google Analytics report. Currently we support more than 10 API functions such as:
- Get users by View ID
- Get traffic by View ID
- Get pageviews by View ID
- Get sessions by View ID
- Get goal conversion data by View ID
- Get lifetime value and cohorts data by View ID
- Get Google Adwords data by View ID
- Get Google Ecommerce quantity data by View ID
- Get Google Ecommerce transaction data by View ID
- Get Google Ecommerce product data by View ID
- Get Google E-commerce refunds and purchases data by View ID
- Get Google E-commerce local transitions dara by View ID
Other important features of Stackby’s Google Analytics tool include:
- Integration with Google Analytics (UA) API and Google Analytics (GA4) to track Users, Traffic, and Sessions Data
- Real-time report generation
- Automatic importing of data from Google Analytics to Stackby
- Time-triggered automation to generate a real-time report
- Ability to collaborate with your whole team on one platform
- In-built JSON data explorer to choose which metrics you want to include in your report
- Ability to create different views to share with different stakeholders and team members
- Google analytics report template to get you started without any hassle
Pricing: You can use Stackby for free for a lifetime! However, if you want extended functionality, you need to buy the paid version. Stackby has a limited-time annual deal where instead of $9 per month, you can get the paid version at a fixed renewal price forever.
2. Whatagraph
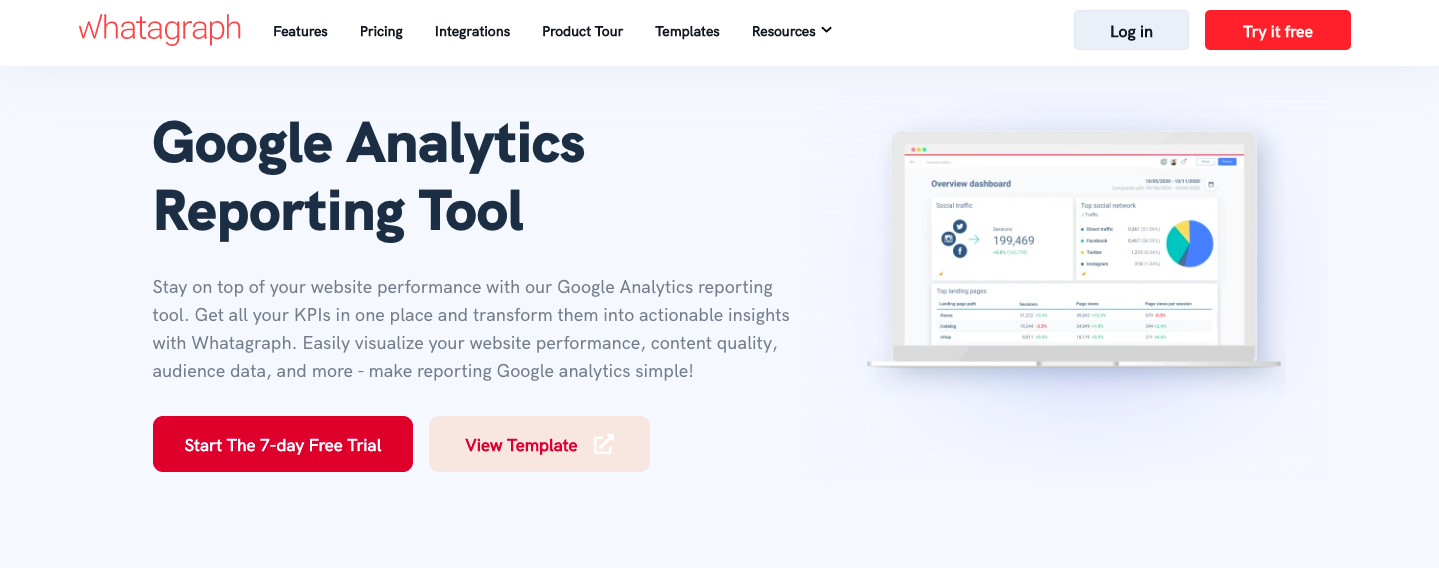
Whatagraph is another Google Analytics Reporting software that allows you to bring all KPIs into one place and transform them into actionable insights. Some of its top features include:
- Automatically collects Google Analytics data for all your KPIs such as website traffic, audience, acquisition, behavior, and conversions insights
- Includes google analytics report template to provide in-depth insights about your website
- Easy to build cross-channel reports and analyze how a particular campaign is performing
- Reporting automation and scheduling including PDF reports for short-term goal tracking
Pricing: Whatagraph provides a free 7-day trial. Its professional plan is $199 per month.
3. DashThis
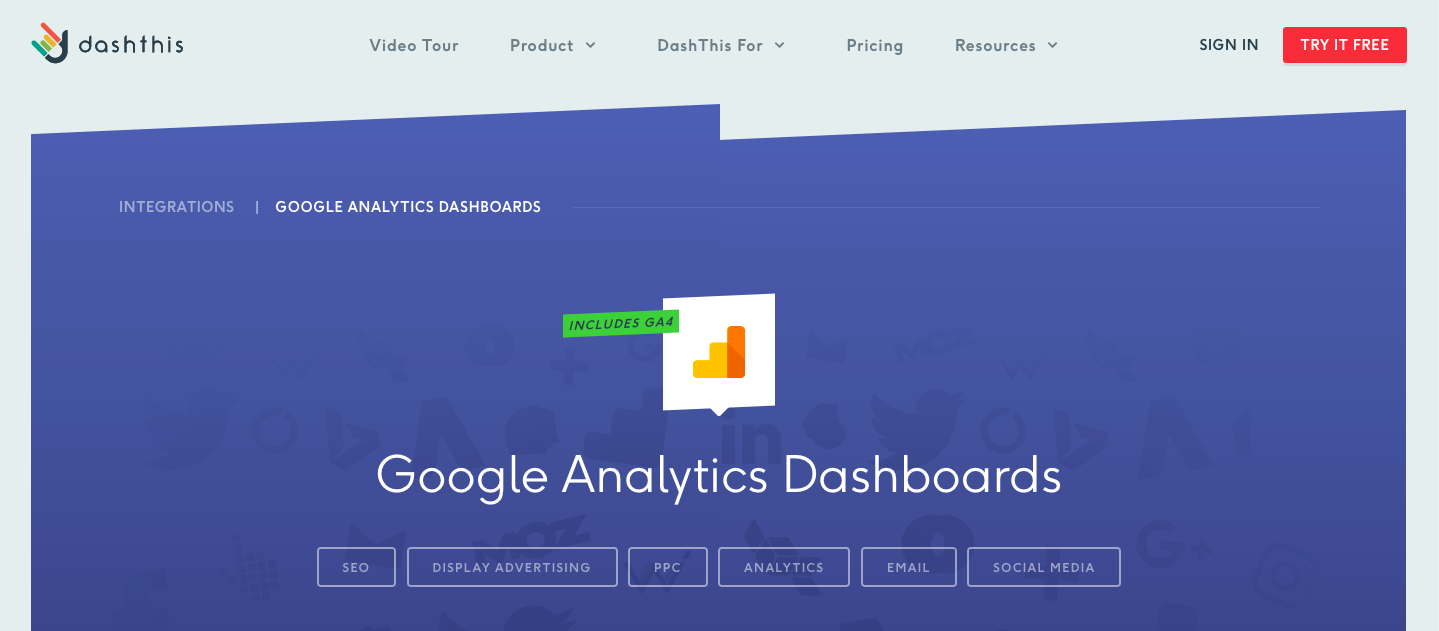
DashThis Google Analytics report generator provides an easy way to assemble all your Google Analytics data in one place and create Google Analytics dashboards.
- Add widgets to create a clean report layout that includes all the information you need
- Add your logo to the report and make the dashboard reflect your brand
- Preset widgets with the most important KPIs that you can drag and drop in your report
- The top 10 metrics that you can measure with DashThis Google Analytics report are Pageviews, Per Session Value, Bounces, Goal Conversion Rate, Cost per Transaction, AdSense CTR, Language, Age, etc.
Pricing: DashThis gives a 15-day free trial offer to its users. After that, you have to buy a paid plan of $33 per month, $109 per month, $ 209 per month, or $339 per month.
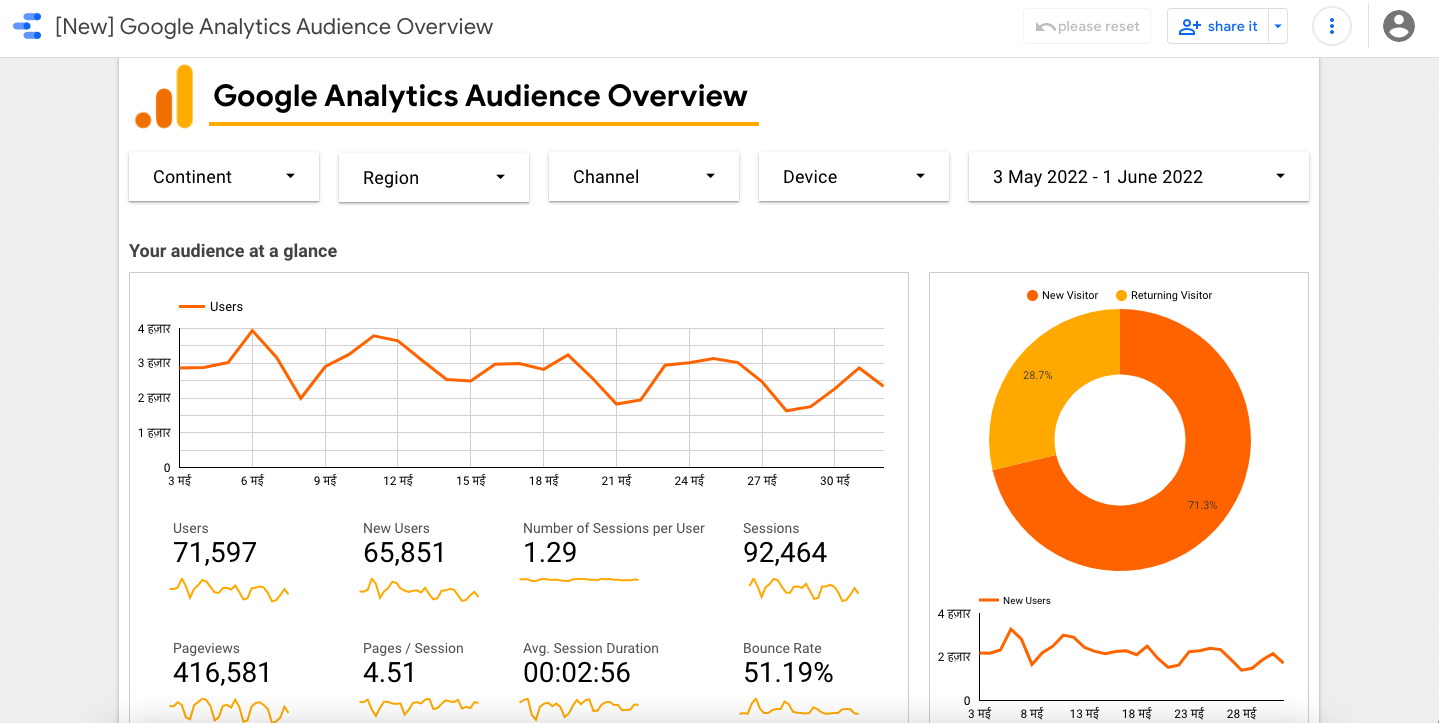
Google has created a data reporting tool called Google Data Studio that you can use for creating Google Analytics reports. It is a comprehensive tool and getting started with it can get quite difficult at first. So if you are planning to use this tool, make sure you have some time to understand its functionality.
- Includes a report galley that provides ready-made reports
- Google Analytics ready-made report includes information about sessions (direct, paid search, display, affiliates, etc.), location, users/audience, devices, etc.
- Reports can be customized as per your business requirements
- Includes no support
Pricing: Google Data Studio is a free tool that can be used as a Google Analytics report generator.
5. Google Analytics Spreadsheet Add-on
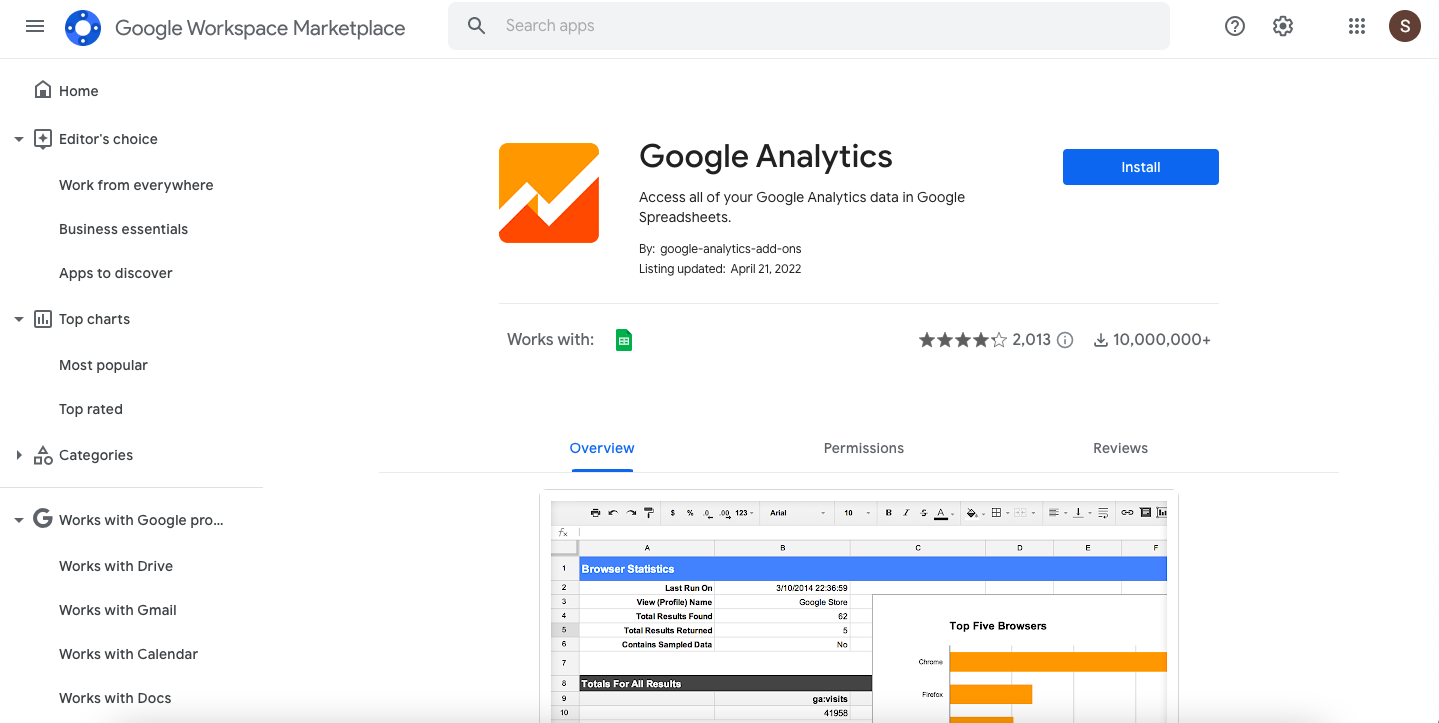
It is a Google Analytics report generator tool that you can use for Google sheets and create Google Analytics reports in your Google sheets easily. This tool is amazing to use but it is not beginner-friendly just like the Google Data Studio.
- Multiple views for querying and reporting data
- Compute calculations and display them in your report
- Schedule reports to update automatically
- Create visualizations and embed them on third-party websites
- Print results of the Google Analytics report on a separate sheet
Pricing: Google Analytics Spreadsheet Add-on is free to use.
6. Raven Tools
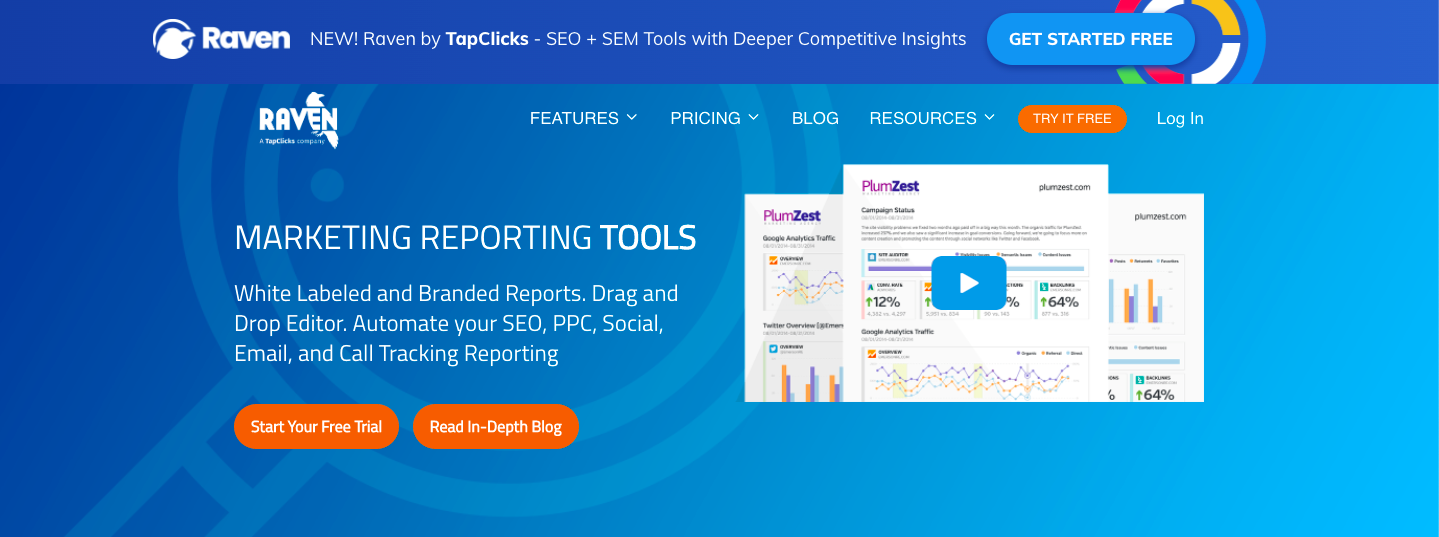
Raven tools include SEO reporting and dashboard tools where you can combine data and reports with SEO tools like keyword ranking monitoring, keyword research, and a site auditor.
- Review click-through rate
- Discover the organic performance of your content
- Segment search behavior based on demographics
- View ranking positions, clicks, impressions, and CTR all in one place
- Built-in report builder to share responsive HTML reports or PDFs
Pricing: The cheapest plan for Raven Tools Google Analytics Reporting is $39 per month.
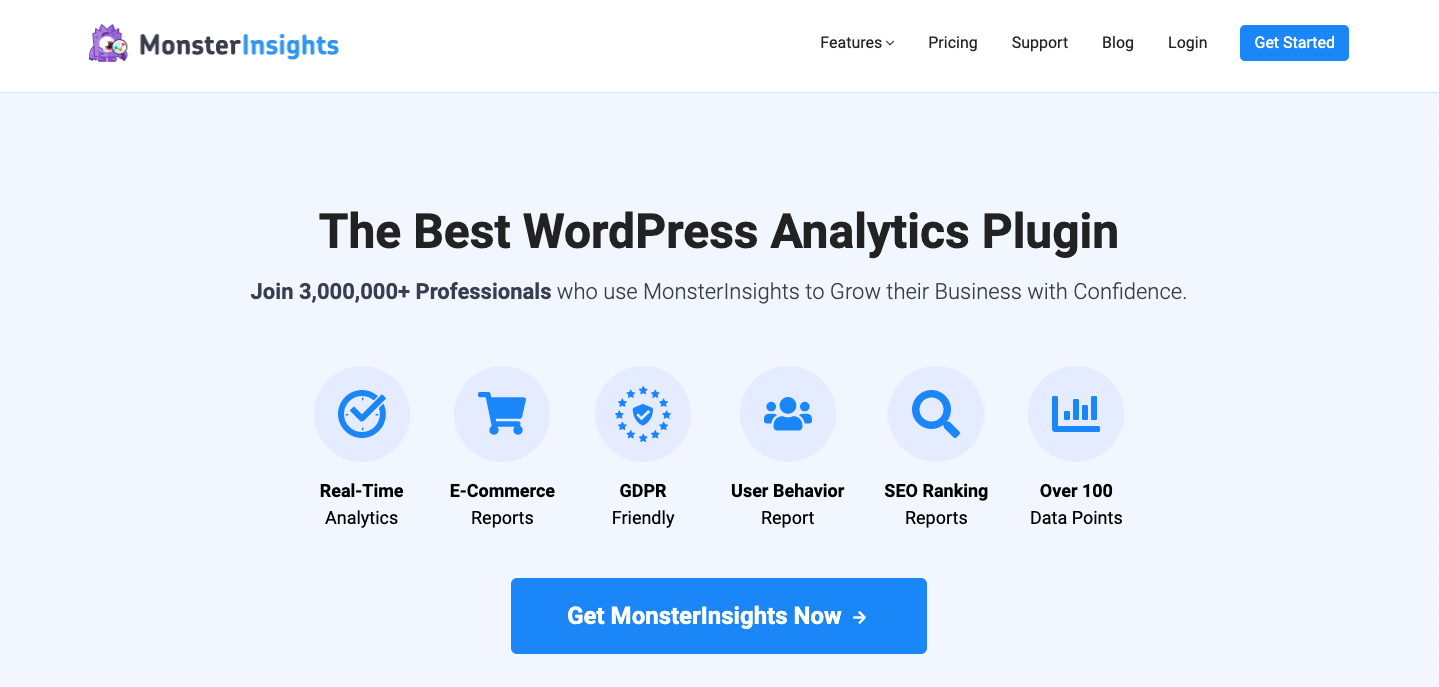
MonsterInsights does not provide a separate tool but a plugin for WordPress that helps you create Google Analytics reports. With this Google Analytics reporting tool, you can connect your WordPress site with Google Analytics so you can view all the data that matters most right in your WordPress dashboard.
- Get real-time statistics
- Google Analytics enhanced ecommerce tracking for WooCommerce, Easy Digital Downloads & MemberPress
- Detailed analysis for every page and post
- Automatically tracks clicks on affiliate links, banner ads, and other outbound links
Pricing: MonsterInsights has paid plans starting from $99.50 per month.
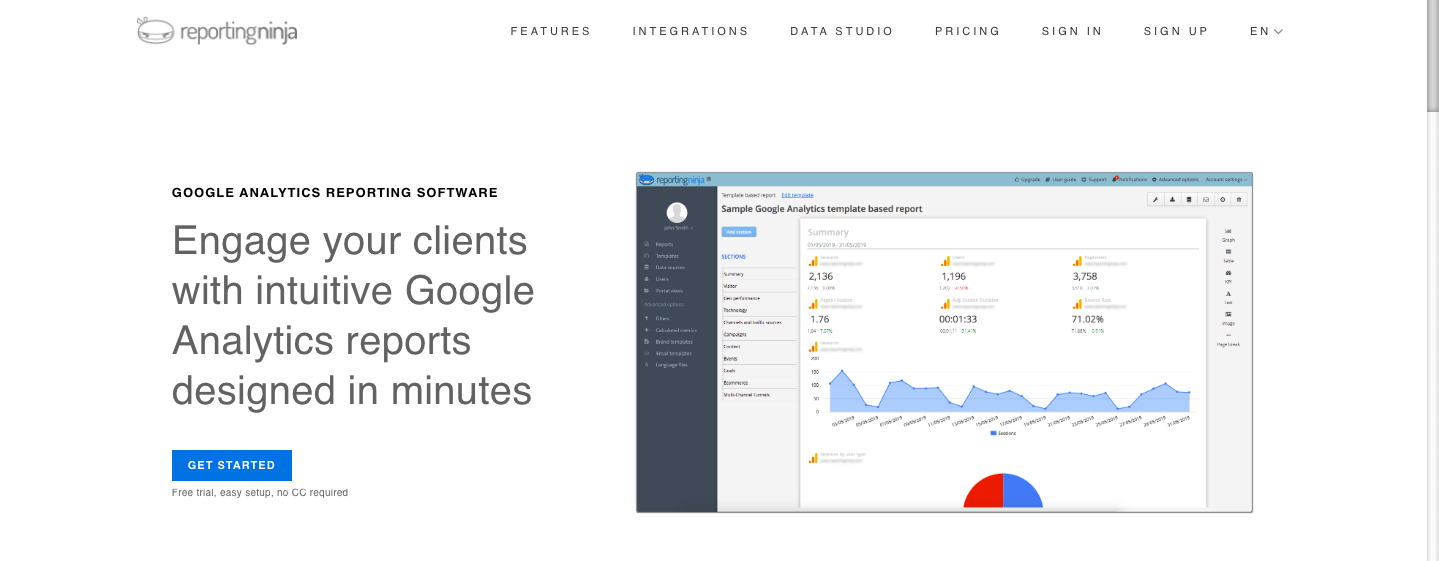
My last suggestion for a Google Analytics reporting tool is ReportingNinja which makes it easier to build custom reports.
- Includes drag and drop features so that you can add blocks of content in your report easily
- Includes an intuitive report editor that previews how your report would look like
- Provides simple templates to get you started
- Includes a widget library that allows you to create what you want to
- Add personalization elements to your report like brand name, brand logo, colors, type and size of fonts, etc.
- A collaborative platform that allows you to view reports whenever you need
Pricing: This software is not free but offers a 15-day free trial. Their paid plans start from $20 per month.
It’s your turn to try! Check the features of these Google Analytics Reporting tools closely and shortlist a few tools that fall within your budget and your business requirements. Try them for a few days and then choose a winner!
If you want to try Stackby, sign up for free here and check our customizable Google Analytics Reporting Template.
Learn how to create a Custom Google Analytics Dashboard step by step on Stackby:
Frequently Asked Questions
1. How to bring a Google Analytics report to spreadsheets?
Using the Stackby column linked API connectors, you can connect to both Google Analytics (UA) and Google Analytics (GA4) APIs and bring API data directly in your tables from the View IDs. You can bring users, sessions, traffic, goal conversions, e-commerce data etc. from these pre-built API functions.
2. Which Google Analytics reports should I send to my clients?
You can share users, traffic and sessions reports, browser reports, site speed reports, content efficiency reports, social media reports, and goal conversion reports with your clients. You can easily create these reports using a Google Analytics Reporting tool.
3. What are some important metrics to track in Google Analytics?
You must track KPIs like traffic sources, bounce rate, number of users and sessions, conversion rate, Google adwords data, and average time on page in Google Analytics. You can use different API functions like ‘Get traffic by View ID’, ‘Get goal conversion data by View ID’, ‘Get Google Ecommerce transaction data by View ID’ etc. in Stackby to fetch the required metrics.
![Best 14 HR Database Software for Recruitment Agency [Free+Paid] [2026]](/blog/content/images/size/w960/2024/04/stackby--hr-database-software-blog-post-5.3.jpg)
![A Simple Guide on Workflow Management Software [Updated 2026]](/blog/content/images/size/w960/2021/12/work-management-blog.png)
![Step by Step Guide on How to Build Forms in a Database [2026]](/blog/content/images/2022/03/form-database-blog.png)